How much solar do I need for my RV?
Enough to put back what you use on an average day where you camp, and the "where you camp" half moves the answer more than any other input. The Power Budget's weekend couple, with lights, a propane fridge and some TV, uses about 1,425 Wh a day (the Power Budget builds your own figure). What that costs in panels depends on the sun:
| Where | Peak sun hours | 400 W makes | To cover 1,425 Wh | Buy |
|---|---|---|---|---|
| Arizona, summer | 9.4 h | 2,639 Wh | 216 W | 300 W |
| Arizona, annual average | 6.5 h | 1,820 Wh | 313 W | 400 W |
| Texas, annual average | 5.3 h | 1,484 Wh | 384 W | 400 W |
| US average (4.5 h) | 4.5 h | 1,260 Wh | 453 W | 500 W |
| Michigan, annual average | 4.0 h | 1,120 Wh | 509 W | 600 W |
| Washington, winter | 0.95 h | 266 Wh | 2,143 W | 2,200 W |
Annual-average peak sun hours by state from Unbound Solar's state table, which Unbound builds from NREL's PVWatts data and the National Solar Radiation Database (NREL solar resource maps). Summer and winter multiply that by the state's June and December share of the year's sun on a flat surface at its capital, from NASA POWER's 2001–2025 climatology (Arizona 1.45 in June, Washington 0.25 in December). Flat-mounted array at 70% of rated output. Computed by the engine above.
The same day takes 216 W of panel in an Arizona summer and 2,143 W in a Washington winter, 9.9× as much, because a flat panel at Olympia gets 25% of its annual-average sun in December. Pick your state above, pick the season you camp in, and size to that, or to the worst of the places you go if you want one array for all of them.
Why "watts × sun hours" overstates what a roof makes
A panel's rating is measured at 1,000 W/m², a 77 °F (25 °C) cell and full sun on its face. An RV panel lies flat, so the sun reaches it at an angle for most of the day. It also runs hot: at the industry's nominal operating test (800 W/m², 68 °F air, a light breeze, open back), Renogy's 100 W flexible panel reaches 45 °C (113 °F), and a panel with no air gap under it runs hotter still, by 10 °C or more for roof-integrated mounting. The same sheet gives −0.38% of power per °C above the rating, about 0.21% per °F, a little under the 0.4–0.5% per °C PVEducation gives for silicon, so that test temperature alone costs 7.6%. Wiring and the controller each take a little more.
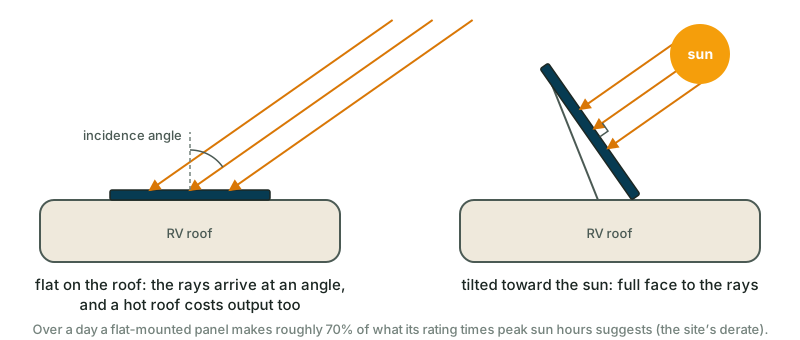
This site's planning figure for a clean, unshaded, flat-mounted array is 70% of rated over the peak-sun hours: 400 W at 4.5 hours is 1,260 Wh, against the 1,800 Wh the box math gives. The common "multiply by 1.5 for losses" rule reaches for the same correction from the other direction; this page states the derate and shows it in the math, so you can change it if your panels tilt.
Two numbers decide whether the next dollar goes to panels or batteries. If the array's average harvest is less than the day's use, you're solar-limited: the bank drains a little every day no matter how big it is. 400 W on a 400 Ah bank at 1,822 Wh a day loses 562 Wh daily and is empty in 7 nights. If the harvest covers the day but the bank can't carry a night, you're bank-limited: 800 W on one 100 Ah lithium makes 2,520 Wh but has only 1,024 usable for the 1,822 Wh night, and most of the afternoon's sun goes nowhere because the bank is full. The result above says which one you are, and what closes the gap.
How many days of cloud should the bank cover?
Solar sizing pages call this "days of autonomy," and it's a question about the bank more than the panels: usable watt-hours divided by the day's use. Two days is the usual planning figure for a rig that can move or start a generator; three or four for winter or the Pacific Northwest. The tool reports what your bank carries and the usable watt-hours you'd need for the days you asked for, at 80% depth of discharge for lithium and 50% for lead-acid, so the answer is in batteries you can buy rather than label amp-hours (the battery-bank calculator counts them). Then it tells you how many sunny days the surplus needs to refill the bank afterwards, which is the number that decides whether an oversized array is worth it: a bigger array refills a bank faster without making it any bigger.
What size charge controller do I need?
An MPPT controller's rating is its output current into the bank: array watts divided by the bank's voltage, rounded up to a size you can buy. 400 W on 12 V is 33 A, so a 40 A controller. The same array on 24 V needs half the amps, which is the case for 24 V banks in a sentence. Match the controller's maximum input voltage to the panels' open-circuit voltage in series on the coldest morning (Voc rises as panels cool), and skip PWM controllers on anything but the smallest kits: they clamp the panel to battery voltage and waste 20–30% of a modern panel's output. Series wiring also shrinks the roof cable: the wire-size calculator sizes the run at the array's voltage.
How many watts of solar for boondocking?
The tiers below are the Power Budget's own typical days, and the array to cover each one on an average roof, in the sunbelt, and in a northern winter:
| How you camp | Wh/day | US average | Arizona | Washington winter |
|---|---|---|---|---|
| Weekend couple, propane fridge | 1,425 | 500 W | 400 W | 2,200 W* |
| Full-time couple, 12 V compressor fridge | 3,043 | 1,000 W | 800 W | 4,600 W* |
| Family of four, 12 V compressor fridge | 3,069 | 1,000 W | 800 W | 4,800 W* |
| Working from the rig, 12 V compressor fridge | 4,959 | 1,600 W | 1,200 W | 7,600 W* |
| Full-time couple, residential fridge | 4,335 | 1,600 W | 1,000 W | 6,600 W* |
Daily figures are the Power Budget presets of the same name in mild weather; a winter day adds furnace-blower hours on top. Array sizes rounded up to common kit sizes. * Past 2,000 W, the largest kit size here, the array is bigger than most RV roofs hold, and a generator or a bigger bank closes the gap instead.
Going from 200 W to 400 W adds 630 Wh on an average day, close to the 660 Wh a 12 V compressor fridge uses. Going from 800 W to 1,000 W adds the same 630 Wh, but on a rig that's already covering its day it mostly buys a faster refill after clouds. Early panels replace generator hours; later ones shorten the wait after a gray spell. The result above tells you which regime you're in before you buy.
How many 100 W or 200 W panels is that?
Divide the array by the panel and round up, but choose the panel by the roof rather than the arithmetic. A 200 W rigid panel is roughly 5 ft by 2.3 ft; a 100 W is about half that. Most travel trailers can take 400–600 W of rigid panels around the vents and the AC shroud before shading becomes the problem, and shading matters more than watts: a shadow across one cell can drop a whole series string, so two 200 W panels wired in parallel through an MPPT controller usually beat one 400 W panel that catches the AC's shadow at 3 p.m. Flexible panels buy roof space at a cost in heat and lifespan. Portable panels solve the other problem, the rig parked in the shade for a reason, and count toward the array on the days you deploy them, not the days you don't. The array size above is rated watts total; the Power Budget's day and this page's result are the same whether it's two panels or four.
Does solar work in winter?
Less than half as well, in most of the country. Shorter days, a low sun on a flat panel, and snow that has to be cleared cut December harvest to 41% of the annual average at the median lower-48 state capital, from 25% in Washington to 58% in Florida; 37 of the 49 fall under half. Meanwhile the furnace blower adds hundreds of watt-hours to the day's use. The winter setting above applies your state's December share; combine it with the cold-night furnace figure from the Power Budget and the answer is usually a generator or a bigger bank, with more panels a distant third.
Sources
- Peak Sun Hours by State: Map, Table & Calculator, Unbound Solar: Annual-average peak sun hours for every state, which Unbound bases on NREL PVWatts data from the National Solar Radiation Database
- Solar Resource Maps and Data, National Renewable Energy Laboratory: The NSRDB solar resource data behind the state table (link not re-checked: nrel.gov did not resolve when this list was built)
- NASA POWER: Prediction Of Worldwide Energy Resources, NASA Langley Research Center: Monthly climatology of sun on a flat surface (ALLSKY_SFC_SW_DWN, 2001–2025) at each state capital: December ÷ annual and June ÷ annual are the winter and summer factors
- 100W Flexible Monocrystalline Solar Panel, RNG-100DB-H (data sheet), Renogy: Temperature coefficient of Pmax −0.38%/°C; NOCT 45 ± 2 °C
- Effect of Temperature, PVEducation: Silicon cells lose 0.4–0.5% of maximum power per °C
- Nominal Operating Cell Temperature, PVEducation: NOCT test conditions (800 W/m², 20 °C air, 1 m/s wind, open back); roof mounting with no air gap runs 10 °C or more hotter